Real-Time Mesoscale Analysis
(RTMA | RTMA-GUAM)
☰
Menu
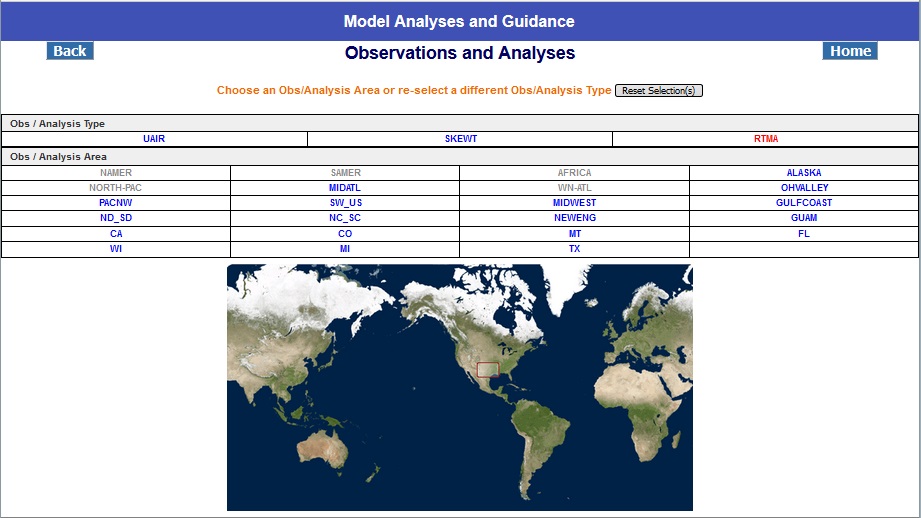
When the user selects the ‘RTMA’ Obs/Analyses type from the Observations and Analyses page, the corresponding regions available for RTMA are highlighted in blue. The remaining regions are shown in gray. When the user selects a region of choice, the user is presented with the RTMA page as shown in below.
The figure below show the page generated after clicking on "RTMA" and "NC_SC". The RTMA page presents the user with the available cycles in an accordion box. The default is the latest cycle, shown in red, at the top of the list. The available Surface Product names are displayed in an accordion box to the right. The Region Map is shown in an accordion box below the products box.
The accordion boxes can be closed by clicking on the title. Clicking the title again will open the box. A minus symbol (-) on the righthand side of the title indicates clicking on the title will close the box. A plus symbol (+) indicates clicking on the title will open it.

To view the RTMA data, select a cycle (or do nothing, and accept the default), then click on a surface product link. The image will be shown in a page, as shown below:
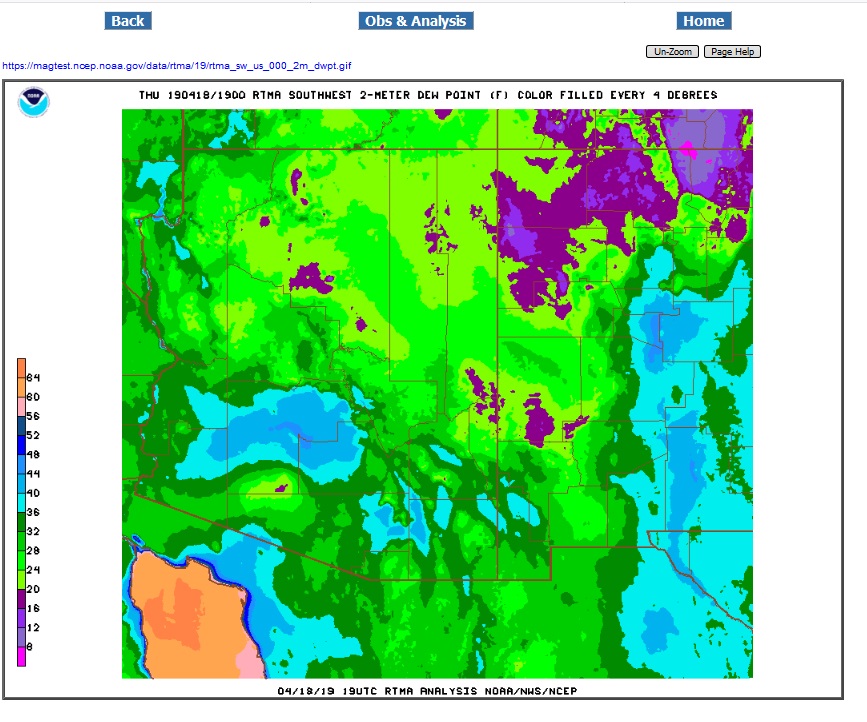
The user can zoom in or out on the image:
- Zoom In - Click on the image, or hover the mouse over the image and rotate the mouse wheel.
- Zoom Out - Ctrl-Click on the image (hold down the Ctrl key, then click with the mouse), or hover over the image and rotate the mouse wheel.
- Restore to original size - Alt-Click or Ctrl-Alt-Click on the image (hold down the Ctrl and Alt key, then click with the mouse), or click the Un-Zoom button.
The static URL (link) of the image is provided just below the title of the page. The link may be used to save the image to your device, or bookmark the chosen product and cycle.
- View Image - Click on the link to display the image in a new window
- Save Image - Right-Click on the link, then select "Save as", then specify where to save to.
- Bookmark Image - Right-Click on the link, then select "Bookmark" or "Add to Favorites". Or open in new window/tab, then click the bookmark icon (a star in many browsers).